Singapore Equity Digest: Buyback Candidates
A major indecision last week for the Singapore equity market with the week closing on a doji pattern (unchanged) in the weekly charts, with slightly higher than average volume of 1.14 billion vs a 30 week average of 0.98 bio.
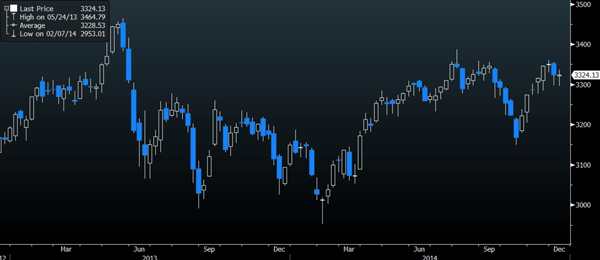
STI Index 2-year weekly candlestick chart
Doji patterns typically signify reversal of trends or continuation of trends but I would read this one in the context of the highest number of buybacks we are seeing for the year.
Last week, Keppel Corp joined in the stock buyback fray, buying back 1.56 million shares daily over 3 days between 10-13 Dec. I do not think this is the last we will see of them.
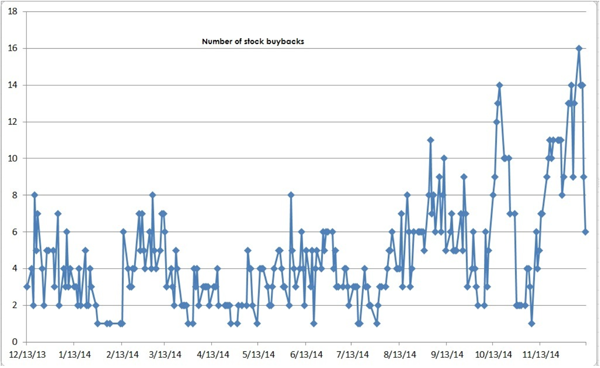
Chart of the number of daily stock buybacks in Singapore over 12 months
Stock buybacks have been blamed for much the S&P’s meteoric rise this year, limiting supply of shares and leading investors to chase the cash rich companies that are expected to repurchase shares.
With limited data on the STI, I decided to graph the S&P Buyback Index against the index itself. It shows a good correlation between buybacks and stock market peaks.
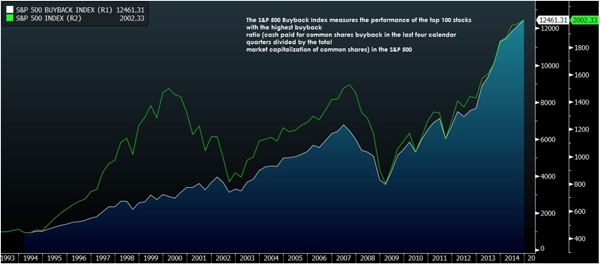
The chart does not tell us when the peak will occur or when to expect it, especially after the S&P’s dismal performance last week, closing 3.5% lower on oil price woes. We have the Federal Reserve FOMC meeting next Thursday (2am SG time) that is likely to dictate the direction for markets into year end.
Going by the buyback trend, we should expect more buybacks to occur if prices head lower. Thus, I have decided to profile the typical buyback company.
Picking from a list of stocks whose prices have fallen 20% or more in the past 3 months, I extracted those whose net cash positions (i.e. cash minus total liabilities) do not fall short of more than 100% of their market capitalisation, which roughly considers maintaining leverage ratios.
This method is hardly fool-proof as it does not consider future earnings, price-to-book valuations, and other cash commitments of the companies.
To my surprise, I found several net cash positive companies – companies whose cash and cash equivalents are enough to pay off all debts and the entire market cap of the company.
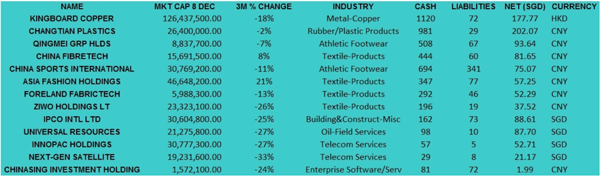
Table of net cash companies in Singapore
There are 84 candidates, including the list above, that I managed to shortlist, representing roughly 10% of listed companies in Singapore. Not surprisingly, we find some familiar names on the list, companies that have been active in the buyback market.
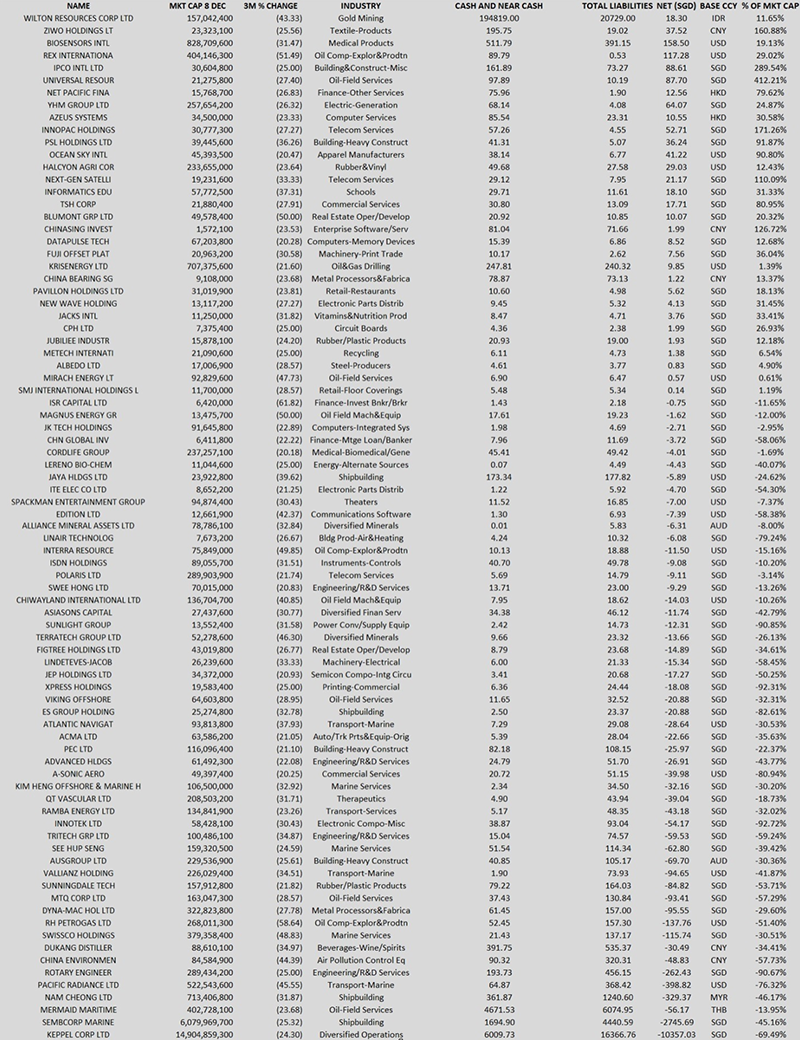
Do note that some of the information may be dated, using 2013 financials where latest numbers cannot be obtained.
Comparing against the list of buyback names this year.
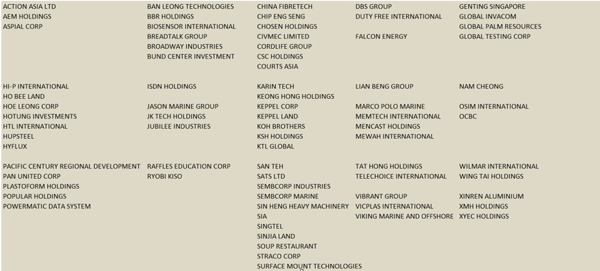
Listed companies that have conducted stock buybacks in the past 12 months
By no means should the above information taken to constitute financial advice or recommendations as much as this exercise to compile and analyse the data has been informative and, to a certain extent, educational.
Current market conditions warrant a lot of added care rather than blind investing. The latest recommended trades have all been trending towards financials and companies that benefit from the oil price decline which has seen some stock prices massively inflate.
I find that we cannot assume that all ships will sink in the oil storm and there are pockets of profit to be made if we look in the right places.