Do Long Term Investors Always Win?

It is apt that I am writing about this today which could turn out to be the worst day for markets in many years, from before and from now.
Try this exercise.
Type “Invest in shares and lost money” into Google Search. The results are quite interesting, just scroll past the first 1-3 pages, and wow a spectacular list of sob stories clustered around specific crash years 0f 1987, 1994, 1997, 2001 and so on, including a biggest 1 day fall in Bangladesh markets back in 2011 that resulted in an investor demonstration against riot police.
I have a good friend of many years whose mother had managed to educate in Australia for her tertiary degree on a single investment strategy – HSBC shares, which she religiously believed to be the creme de la creme of the blue chips for Hong Kong in those days. Each month, her mother would dutifully put a sum into the shares and left them there till my friend was ready to start school.
Incidentally, I met another of such mothers recently who was bemoaning to me about her portfolio losses which I mentally assumed to be not so much actual losses per say, but mark to market losses from their peak earlier this year.
It got me wondering if such a strategy is sound after reading about some investors who had held on through the dot-com bubble burst and still lost money despite the recent rally that drove stocks to record highs.
Surely it would not have worked if she had chosen Citibank shares and if her daughter was getting ready to go to school next month because the 10 year annualised total returns (including dividend reinvestment) of Citibank is errr, -16.88%. Aha, but that assumes you bought Citibank 10 years ago. Thus, I went checked up assuming she had invested in Citibank dutifully each month since 2005 and got a much better result, she would have just lost -67% of her capital on average over 10 years (which is better than -168% had she bought 10 years ago and sat on it).
Still, it does not make the strategy sound at all for who would want a loss after 10 loyal years?
I was pretty sold on this chart last year which I dutifully plotted after a friend expounded on his value investing strategy and dismissed the hype on the EM boom.
“So much for your brokers and their hype about the EM boom story, if you had invested in Mcdonalds or IBM 20 years ago, your returns would have quite outstripped the returns on a MSCI Asia Ex Japan Fund or unit trust.
IBM +1700%
MCD +675%
MSCI Asia Ex Japan +47%
MSCI Asia Ex Japan Small Cap +102% ”
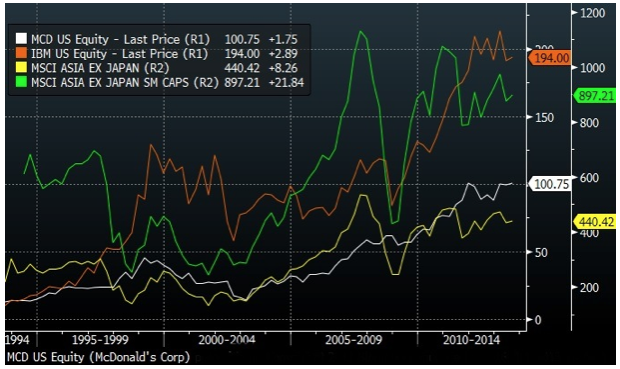
This is assuming you had plowed that entire nest egg into IBM back in 1994, sat through the dot-com burst in 2001 followed by half a decade of rangy prices, the Global Financial Crisis and waited till 2011 before IBM’s stock price rose above its previous high back in 1999.
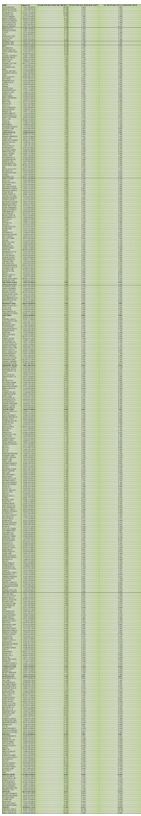
Perhaps I was the cat who was killed by curiosity in my past life but I would not let it go and thus I dug up the top 500 market cap stocks just to check on their performances in the last 5 and 10 years.
Of course I sidetracked when I realised that 40% of the companies which were in the top 500 back in 2005 have fallen off the list, Countrywide, Bear Sterns, Fannie Mae, Freddie Mac, Merrill Lynch and Lehman Brothers most prominent, leaving us with 307 and quite a bunch of Chinese names.
Singapore, be proud. From a lonesome Singtel in the Global top 500 in 2005, we now have Singtel (number 224), OCBC (number 448) and DBS (number 336) in 2015!
Yet some familiar names that we grew up with have gone, just like Kodak did a decade ago, it is Gillette, Hershey, Fujifilm, Dell, Nokia, Peugeot, Sharp, Swiss Re, Symantec, Transocean and more, dropping out in this past decade.
Well, the results would make fund managers pleased, or not, and insurance education policies shudder in fear?
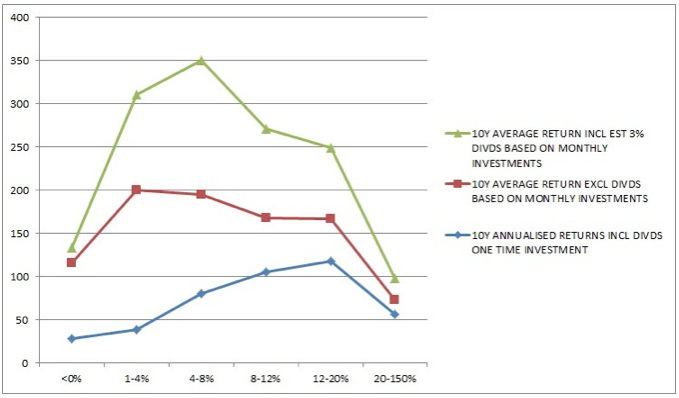
Crunching raw numbers, I attempted to simulate a monthly investment in all those 500 names and compared the numbers against the 10 year annualised total returns. The slight problem with the comparison is the dividend returns which would make all the difference. Thus, I implied an estimated dividend yield of 3% (which is close to 10 year average dividends) into the former to normalise the comparison.
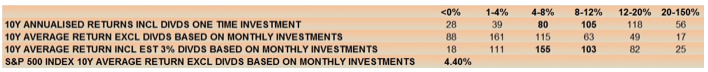
(Note that this table took me 4 hours of number crunching through a matrix to derive although I would not vouch for the accuracy of the numbers)
Looking at the table, we would conclude that the one time investment 10 years ago looks like a better bet.
I would disagree.
The reason the chart looks that way is because investors do precisely the wrong things at the wrong time and thus allowed for such results.
Humans are, sadly, flawed creatures and the human brain is not as efficient and rational as we like to believe. And when it comes to timing, statistics say we do poorly.
Does buying a fund help?
Looking at the S&P’s 10 year return of 4.4% excl dividends and 10 year annualised total returns (incl dividends) of 7%, it falls squarely in the middle.
We must not forget that funds are also managed by equally flawed humans who charge fees and have their bad days even if the fund is an indexed fund or managed by a robot running on a man-made program.
This long term investing idea looks like a good thing but the US Financial Industry Regulatory Authority (FINRA) has this to say about long term investing.
“Based on historical data, holding a broad portfolio of stocks over an extended period of time (for instance a large-cap portfolio like the S&P 500 over a 20-year period) significantly reduces your chances of losing your principal… stocks are always risky investments, even over the long-term. They don’t get safer the longer you hold them.
Investors should also consider how realistic it will be for them to ride out the ups and downs of the market over the long-term. Will you have to sell stocks during an economic downturn to fill the gap caused by a job loss? Will you sell investments to pay for medical care or a child’s college education? Predictable and unpredictable life events might make it difficult for some investors to stay invested in stocks over an extended period of time.
For example, on March 10, 2000, the NASDAQ composite closed at all-time high of 5,048.62. It has only been recently that the closing price has approached this record level, and for well over a decade the NASDAQ Composite was well off its historic high. In short, if you bought at or near the market’s peak, you may still not be seeing a positive return on your investment. Investors holding individual stocks for an extended period of time also face the risk that the company they are invested in could enter a state of permanent decline or go bankrupt.”
Like it or not, there are more people out there hurting today than there were last month and even more than there were 3 months ago.
Many of them will now run and hide behind the “long term investor” excuse for comfort, even the slow and steady ones are probably having doubts as we speak.
This is where I shall say the magic words, “those who buy today are luckier than those who bought last month”.
And I shall leave with a pretty table to show for all the work I have done this morning.