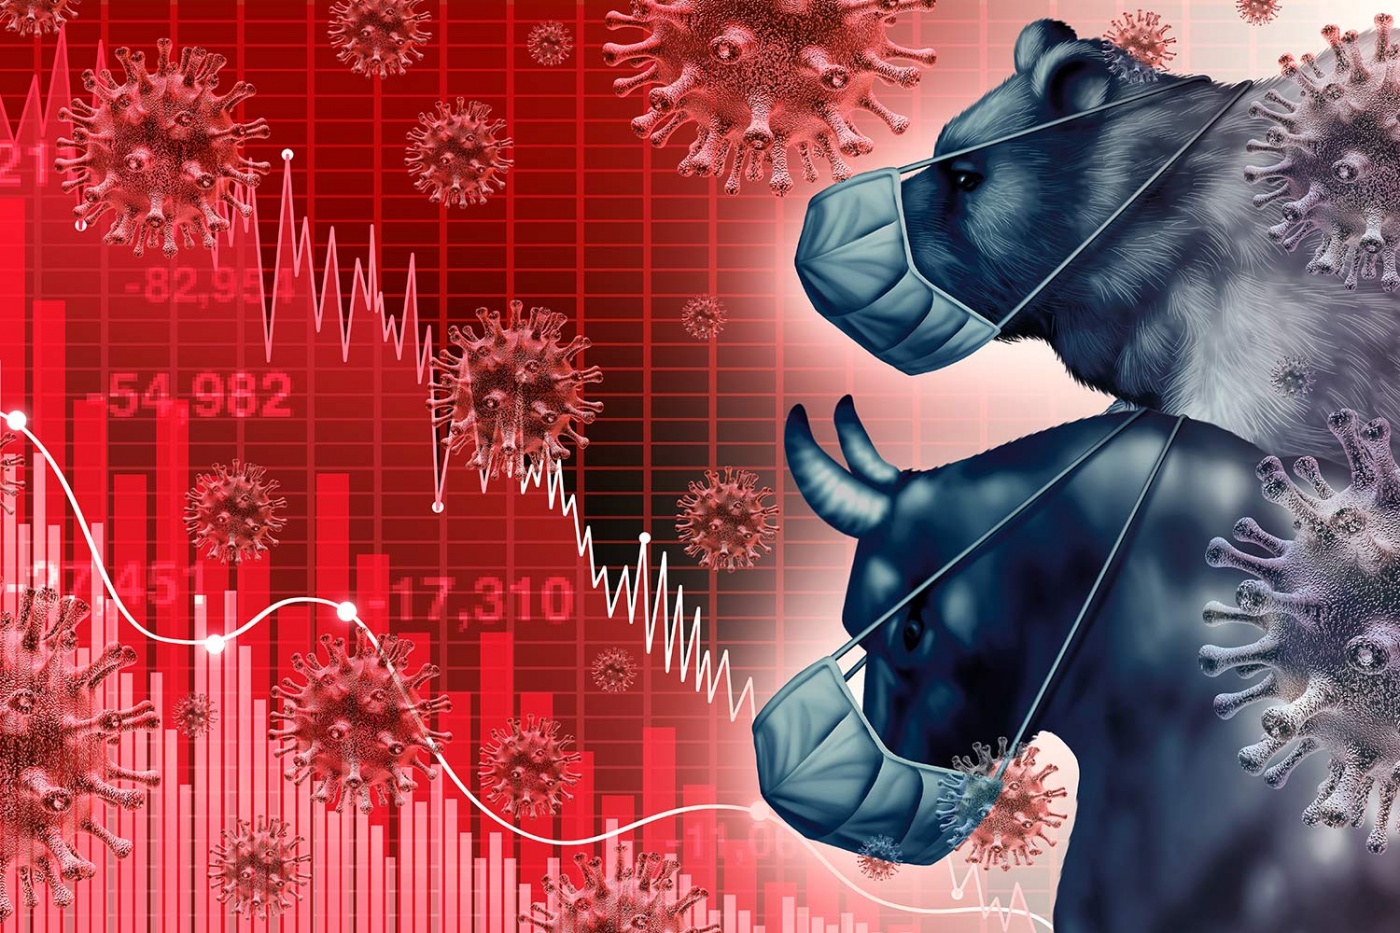
Will Coronavirus Trigger a Global Recession?
For years, financial experts have lamented the lofty market valuations, predicting that the next big recession is on the horizon. In a matter of 10 years, the S&P 500, the Dow Jones Industrial Average and the NASDAQ have all gone up by between 300% and 550% from its trough in March 2009. But no one had the faintest idea as to when or how such an event would occur. Jim Rogers had been calling for a recession saying it would come “next year” for the last 5 years. Well, what a surprise. His predictions have been wrong time and again. Indeed, the markets have a way of proving many experts wrong.
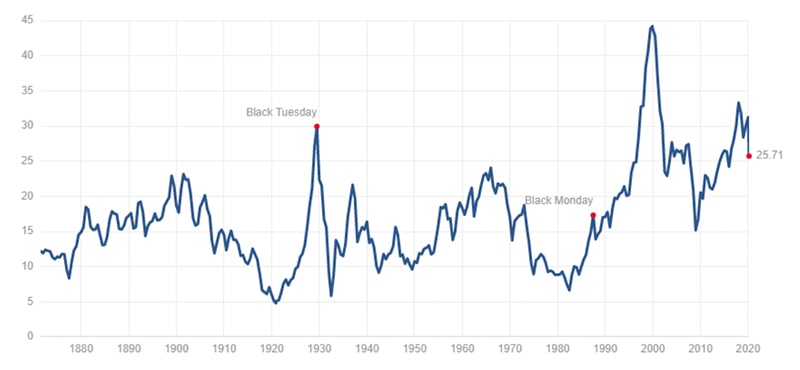
But recently, one of the more reliant indicators of a market top appeared before our very eyes. The Shiller PE ratio or the CAPE ratio (price-earnings ratio based on the average of 10 years of inflation-adjusted earnings) of the S&P 500 reached a high of 32 times, exceeding the high set just before Black Tuesday of 1929. A look back on that historical day showed that the Dow Jones Industrial Average fell by 11.73%. What happened next was a depression so severe that it took almost a decade before the stock indices actually recovered. For many times that the world has had a recession, the Shiller PE ratio exceeded 20 comfortably before a correction set in. For all statistics lovers out there, the mean and median of the S&P 500 is 16.7 and 15.76 respectively. And if you are a believer in mean reversion as I do, perhaps one should be extra cautious in today’s markets.
 Source: Multpl.com
Admittedly, this is a different era from that of the Great Depression, ruled by powerful technology companies whose sole purpose is world domination. With all that cheap money injected into the global economy, it seemed that the growth would always triumph—until now.
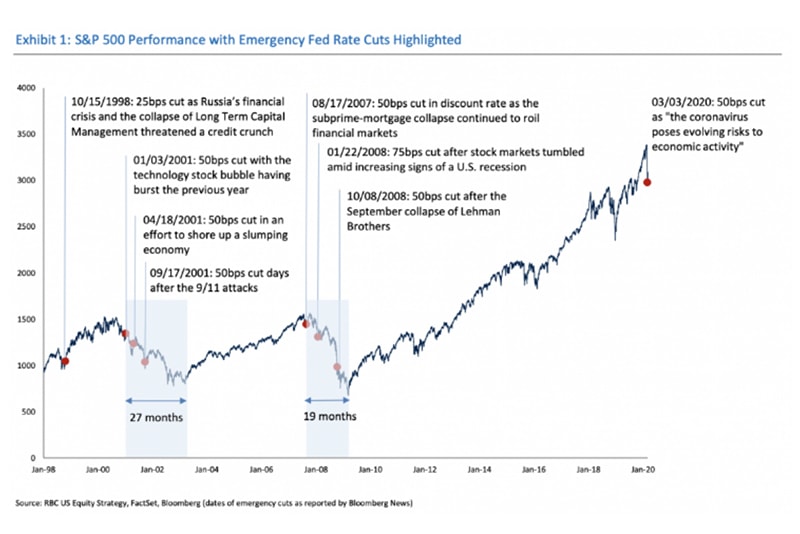
The dawn of 2020 brought with it a catalyst that could trigger the worst recession of our lifetime—the coronavirus disease (COVID-19). Is this the proverbial black swan event? On the 12th of March, the Federal Reserve announced an emergency rate cut by 50 basis points, the first since the 2008 financial crisis. This practically sent the markets into panic-driven sell mode. Emergency rate cuts by definition do not occur lightly. Usually, these emergency rate cuts presuppose a likelihood of weakness in the markets. If history were to be an indicator of how many more are likely to come, we would likely see two more emergency rate cuts.
Markets across Asia have not been spared. The Nikkei 225, Kospi Composite Index, Hang Seng Index and the STI have all fallen by about 13% to 25% since the middle of February. This is in direct correlation to the decimation of U.S. indexes.
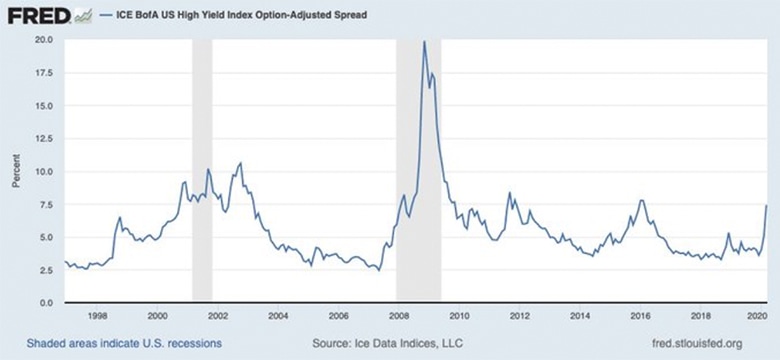
By the 13th of March, high yield spreads spiked to 7.4%. Months earlier, the spreads were lingering near its lows as you can see from the chart below.
 Source: FRED
The high-yield spread represents the difference between the interest rates on bonds which are below investment grade and the corresponding safe interest rate. For this reason, the high-yield spread is a measure of economic distress. Sudden spikes could signal that a recession is on the cards, signified by the grey areas on the chart. For many, a spike to greater than 6.5% would be alarming.
 Source: FRED
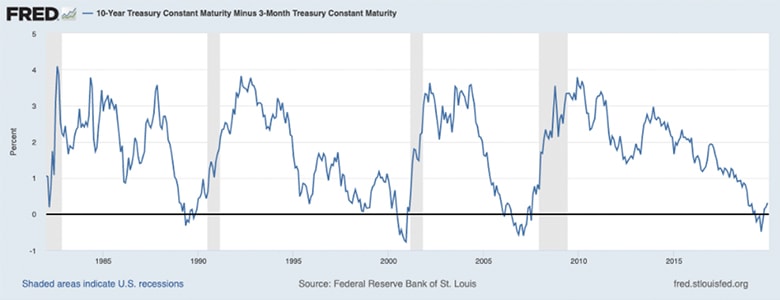
When we talk of recession indicators, we cannot omit the ominous inversion of the yield curve which lasted for a period of 4.5 months from 23rd May 2019 to 10th October 2019. Typically, the 10-year yield is higher than the 3-month yield to compensate investors for longer maturity dates. Examining the chart above, the inversions of the yield curve shown by the line graph dipping below the horizontal axis precedes a recession (areas in grey).
Demand and supply shocks to the global economy
For three months now, the streets of Wuhan, China, where the virus is supposed to have originated from, have been empty. The Chinese government has promulgated draconian measures to lock down the entire city to curb the spread of the virus. The unintended consequences of that could be dire as the nation’s manufacturing output has been stymied for close to a quarter. Entire provinces within China have been on lockdown and factories have been shut, leading to a supply shock around the world as China’s economic activity is inextricably linked to the fortunes of the global economy.
This supply shock basically means two things. Companies are not productive and employees may not be paid during the downtime. With the restriction of mobility in China and around the world, this leads to a demand shock that would reverberate across the world’s economy.
Since the spread of Covid-19 to Europe and other parts of Asia, the number of deaths has spiked significantly in places like South Korea, Italy and Iran. Italy has instituted an entire lockdown of the country and other countries may follow suit after the WHO officially declared it to be a pandemic.
Casually speaking to an F&B entrepreneur in Singapore, he remarked that the past 3 months have been one of the toughest periods he has had to face. There were no easy answers. Staff were retrenched and those who stayed agreed to take home half their salaries. In tourism-related sectors, many employees have been told to take unpaid leave. This looks like a trend that will continue.
A question looms over our heads. Can central banks handle the simultaneous demand and supply shocks? We know from experience that central banks can stimulate demand as it did during the 2008 financial crisis. But how would they stimulate demand on empty streets and pockets? According to Goldman Sachs, oil demand has contracted by approximately 4 million barrels/day. That explains the sudden fall in WTI Crude from above $50 per barrel to $31 per barrel.
What could be worse? If this rare event extends to 3 quarters or more, the results would be unthinkable. Prime Minister Lee Hsien Loong has publicly mentioned that the Covid-19 outbreak will continue for a year or longer. With an estimated R0 of 2.5 and more contagious than the ordinary flu, that does not seem too far-fetched. Scientists have estimated that between 20% and 50% of the global population could be infected and the mortality rate to be in the range of 1.5% to 3.5%. Global leaders have very tough choices to make and none of them are easy—it’s a classic “damned if you do and damned if you don’t” scenario. They could opt for a complete lockdown or continue with “business as usual”—either way, both have consequences.
Debt defaults and a possible financial crisis
The demand and supply shocks are only beginning to have a negative effect on stock markets. As the high-yield spread widens, smaller companies will experience a significant increase in the cost of leverage. Combined with decreasing earnings outlook for many companies, the picture is looking bleak.
When highly leveraged companies cannot pay off the interest on their debt and financial institutions tighten lending, the global economy may go into another downward spiral. Based on the evidence, the markets may have peaked and everything points to a recession.